In this lesson
Open any trading chart and you see candles. Most traders learn to read them in an afternoon, and then spend years being told which shapes mean "buy" and which mean "sell".
This course is about those shapes. But before we test any pattern, we need to agree on what a single candle shows, and what it does not. We also need a fair way to test a pattern, so that "it works" means something you can check.
So this lesson does three things: it explains the parts of a candle, it shows how big candles really are on four popular markets, and it measures what one candle tells you about the next one. The answer to that last part is the foundation for everything that follows.
Four prices in one shape
A candle sums up all the trading in one block of time. That block can be one minute, one hour, one day or anything else. You choose it when you choose the chart's timeframe.
Each candle records four prices:
- Open: the first price of the period.
- High: the highest price reached.
- Low: the lowest price reached.
- Close: the last price of the period.
White body: the price closed higher than it opened. Dark body: it closed lower.
The thick part is the body. It runs from the open to the close. The thin lines above and below are the wicks (some traders say shadows). They show how far the price travelled before it came back.
If the close is above the open, the candle is an up candle. Charts draw it white or green. If the close is below the open, it is a down candle, drawn dark or red. Colours are only a setting, so always check which is which on your own platform.
In MetaTrader 5
Right-click the chart, choose Properties, then the Colors tab. "Bull candle" and "Bear candle" set the body colours. Press F8 for the same window.
The timeframe decides what one candle means
A 1-hour candle and a daily candle look the same on screen, but they describe very different amounts of movement. We measured the typical candle, from its high to its low, on EURUSD, GBPUSD, USDJPY and gold, using real prices from October 2024 to September 2026.
| Market | 1-hour candle | 4-hour candle | Daily candle |
|---|---|---|---|
| EURUSD | 10.9 pips | 23.5 pips | 63.9 pips |
| GBPUSD | 13.7 pips | 29.1 pips | 80.6 pips |
| USDJPY | 19.1 pips | 41.1 pips | 112.3 pips |
| Gold (XAUUSD) | $11.50 | $23.82 | $65.26 |
The median candle, October 2024 to September 2026. A daily candle here is one forex day, ending 17:00 New York time.
A typical 1-hour EURUSD candle covers 10.9 pips. A typical daily candle covers 63.9 pips. On gold, a 1-hour candle covers $11.50 and a daily one $65.26.
This matters for two reasons. First, a pattern on a 1-hour chart and the same pattern on a daily chart are not the same event, so we test them separately. Second, the cost of a trade does not shrink with the candle. The spread you pay is the same whether your stop sits behind a small candle or a big one. Lesson 7 shows how much that changes the results.
Where does a daily candle start?
Forex trades around the clock, so a "day" has to start somewhere. A common choice is 17:00 New York time, when the US trading day ends. Our daily candles use that time, so each one is a full forex trading day. Your broker's server clock may draw the day differently, which is one reason the same pattern can look different on two platforms.
What one candle says about the next
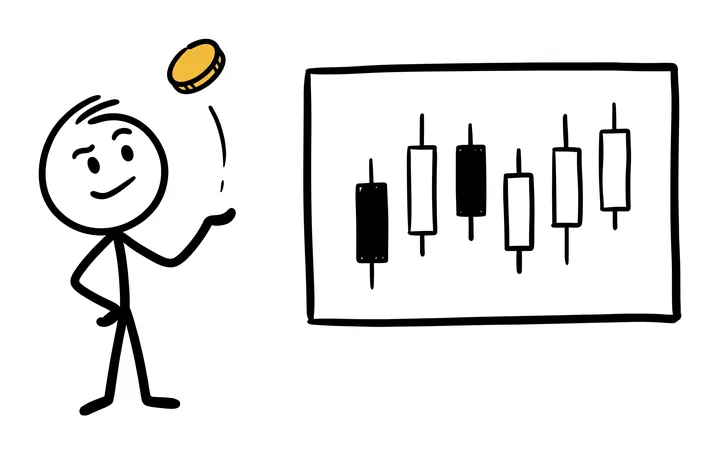
Here is the simplest possible test. If a candle closed up, is the next candle more likely to close up too?
We counted every 1-hour candle on the four markets, October 2024 to September 2026. That is 12,405 candles on EURUSD alone, and 63,432 candles across all four markets and all three timeframes.
| Market | Up candles | Next candle the same colour | Typical candle |
|---|---|---|---|
| EURUSD | 49.3% | 48.4% | 10.9 pips spread 0.4 pips |
| GBPUSD | 50.1% | 47.8% | 13.7 pips spread 0.8 pips |
| USDJPY | 51.7% | 48.7% | 19.1 pips spread 0.5 pips |
| Gold (XAUUSD) | 51.5% | 49.2% | $11.50 spread $0.60 |
Typical = the median. Spread = ask minus bid, the median over every minute. Gold in dollars.
On EURUSD, 49.3% of 1-hour candles closed up. And the next candle had the same colour as the one before it only 48.4% of the time. Across the four markets, that number ran from 47.8% to 49.2%.
In other words, the colour of one candle told you nothing useful about the colour of the next one. If anything, the next candle was very slightly more likely to go the other way. A coin would have done as well.
That is not a surprise to anyone who has traded for a while, but it is worth seeing in real numbers, because every candle pattern makes a stronger claim than this. A pattern says that a certain shape, sometimes in a certain place, tells you where the price goes next. The rest of this course checks those claims, one by one.
Wicks, bodies and what they suggest
Traders read stories into the shape of a candle:
- A long lower wick: the price fell, then buyers pushed it back up.
- A long upper wick: the price rose, then sellers pushed it back down.
- A big body with small wicks: one side was in control the whole time.
- A tiny body: the open and close were close together, so neither side won. This candle is called a doji, and about one candle in ten was one: 11% of 1-hour EURUSD candles had a body no bigger than a tenth of their range.
These stories are a fair description of what happened inside the candle. The question is whether they help you predict what happens after it. That is exactly what we test, pattern by pattern, in lessons 2 to 6.
How this course tests each pattern
Every pattern in this course gets the same test, so the results can be compared:
- An exact rule. "A big candle" is not a rule. "The body is larger than the previous candle's body" is. Each lesson shows the rule we used, so you can check it or change it.
- Real prices, both sides of the spread. We used 1-minute bid and ask prices for EURUSD, GBPUSD, USDJPY and gold, October 2024 to September 2026. Buys are filled at the ask and sells at the bid, so every trade pays the spread.
- A real trade. After the pattern's last candle closes, we enter at the next candle's open. The stop goes at the far end of the pattern. The target is as far away as the stop (1:1) or twice as far (1:2). The 1-minute prices decide which one is touched first. If both are touched in the same minute, we count a loss, because we cannot know which came first.
- A fair comparison. For every pattern trade, we also open random trades at random candles with the same stop distance. If the pattern is useful, it must beat those random trades. Beating zero is not enough, because the stop and target alone shape the result.
- Two separate years. We check October 2024 to September 2025 and October 2025 to September 2026 apart. A pattern that works in one year and fails in the other is not something to build on.
This is stricter than most pattern guides, which show a few good examples on a chart. A few examples prove that a pattern can work. They cannot tell you how often it does.
Key takeaways
- A candle shows four prices: open, high, low and close. The body runs from open to close; the wicks show how far the price went before coming back.
- The same pattern means different things on different timeframes. A typical 1-hour EURUSD candle covers 10.9 pips; a daily one covers 63.9 pips.
- One candle's colour did not predict the next candle's colour: it repeated only 47.8% to 49.2% of the time on the four markets.
- Every pattern in this course is tested the same way: exact rule, spread paid, real stop and target, compared with random trades that use the same stop, in two separate years.
Questions
What do the colours of a candle mean?
An up candle closed higher than it opened and is usually drawn white or green. A down candle closed lower and is usually dark or red. The colours are a chart setting, so check yours.
What is the difference between the body and the wick of a candle?
The body runs from the open to the close. The wicks are the thin lines above and below it, showing the highest and lowest prices reached during the period.
Does an up candle mean the next candle will also be up?
Not in our test. On 1-hour candles of EURUSD, GBPUSD, USDJPY and gold from October 2024 to September 2026, the next candle had the same colour only 47.8% to 49.2% of the time.
Which timeframe is best for candlestick patterns?
There is no single answer, but costs matter more on small timeframes because the spread stays the same while the candles shrink. Lesson 7 compares the results on 1-hour, 4-hour and daily candles.
Why does my broker's daily candle look different from another broker's?
A daily candle depends on when the broker's day starts. Many use 17:00 New York time, others use their own server clock. A different start time gives a different open, close, high and low.
Candlestick patterns, tested
- 1. How to read a candle
- 2. Engulfing patterns, tested
- 3. Hammers and shooting stars, tested
- 4. The doji: indecision or reversal? soon
- 5. Inside bars and breakouts, tested soon
- 6. Morning and evening stars soon
- 7. 1-hour, 4-hour or daily: where costs bite soon
- 8. Luck or edge: reading a test honestly soon
- 9. Test a pattern yourself soon
Educational content, not financial advice. Trading forex and CFDs carries a high risk of losing money. Examples use round numbers to show the method; check your own broker's contract specifications and your firm's rules.