In this lesson
Most new traders spend their first months hunting for the perfect entry. A better indicator, a cleaner setup, a smarter time to buy. It feels like the entry is the whole game.
It is not. Two traders can take the exact same trades, at the exact same prices, and one of them ends the year with a growing account while the other one is gone by March. The only difference between them is how much each one lost when a trade went wrong.
This lesson is about that difference. There are no rules to memorize yet. Just three pieces of math that every trader should see once, because after you have seen them, you never look at a big position the same way again.
The hole is deeper than it looks
Picture two holes in the ground. One is shallow. You step down, you climb back out, no problem. The other is so deep that the ladder you brought does not reach the top.
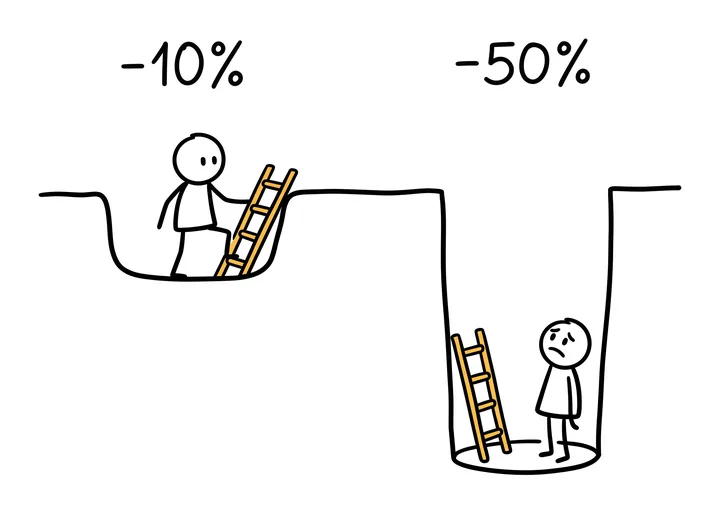
Losses work the same way, and the reason is simple: after a loss, you climb back with a smaller account.
A worked example
You have $10,000. A bad week takes 50% of it, so you now have $5,000.
To get back to $10,000, you need to make $5,000. But you are making it on a $5,000 account. That is a gain of 100%, not 50%.
The bigger the loss, the faster the climb back gets out of reach:
Losing 90% needs +900%, too long to draw. Gain needed = loss ÷ (100% − loss).
A 10% loss needs 11.1% to recover. That is annoying but normal. A 30% loss needs 42.9%. A 50% loss needs 100%, which is a great year for most professional funds. A 75% loss needs 300%. At that point the account is not in a drawdown any more. It is finished, and the trader just has not admitted it yet.
So the first job of risk management is not to make money. It is to keep every loss in the shallow part of that chart, where climbing back is still a normal week of trading.
Losing streaks are normal, not bad luck
Here is the second piece of math, and it surprises almost everyone.
Imagine a strategy that wins exactly half of its trades, so every trade is a coin flip. Over 100 trades, how likely is it that you hit 5 losses in a row at least once?
Most people guess something like 10%. The real answer is 81%.
A strategy that wins 50% of its trades. Exact probabilities, not a simulation.
We calculated these numbers exactly (not with a simulation) for 100 trades at a 50% win rate:
- At least 3 losses in a row: 99.97%, so practically certain.
- At least 4 in a row: 97%.
- At least 5 in a row: 81%.
- At least 6 in a row: 55%, slightly better than a coin flip.
- At least 8 in a row: 17%, about one trader in six.
And many good strategies win less than half the time. Trend-following systems often win 40% of their trades and make their money on a few large winners. For a strategy like that, the chance of 6 losses in a row somewhere in 100 trades is 87%.
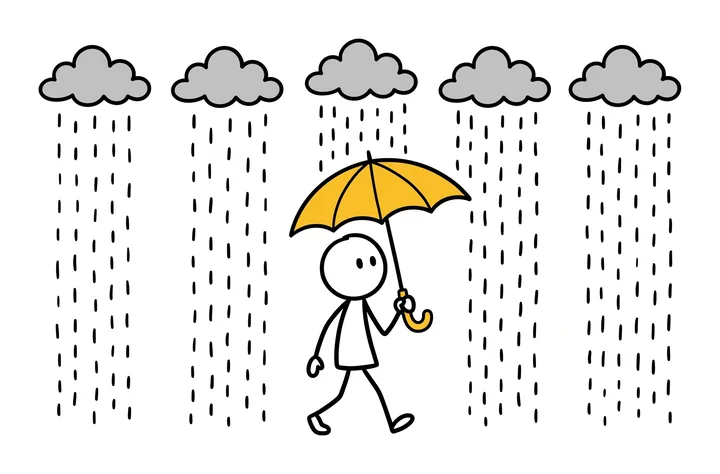
This changes how you should think about risk. You are not sizing your trades for an average day. You are sizing them for the streak that is coming, because it is coming. The only question is whether you will still be standing with your umbrella when the weather clears.
What a streak costs at different sizes
Now put the first two ideas together. Here is what 5 losses in a row do to a $10,000 account, at different amounts risked per trade. Each loss is a percentage of the balance at that moment, which is how most traders size.
| Risk per trade | Balance after 5 losses | Account lost | Gain needed to recover |
|---|---|---|---|
| 1% | $9,510 | 4.9% | +5.2% |
| 2% | $9,039 | 9.6% | +10.6% |
| 5% | $7,738 | 22.6% | +29.2% |
| 10% | $5,905 | 41% | +69.4% |
| 20% | $3,277 | 67.2% | +205.2% |
Each loss is a percentage of the balance at that moment.
At 1% per trade, 5 straight losses leave you with $9,510. You are down 4.9% and need 5.2% to get back. That is a bad week, nothing more.
At 10% per trade, the same 5 losses leave $5,905. You are down 41% and need 69.4% just to get back to where you started.
At 20% per trade, you are left with $3,277 and need 205.2%. That account will almost certainly never recover.
Notice that the strategy is the same in every row. The entries, the exits and the win rate are identical. The only thing that changed is the size.
Trader A and Trader B
Let's make this concrete with a prop firm account, because prop firms make the math very visible. They give you a hard line, and if you touch it, the account is gone.
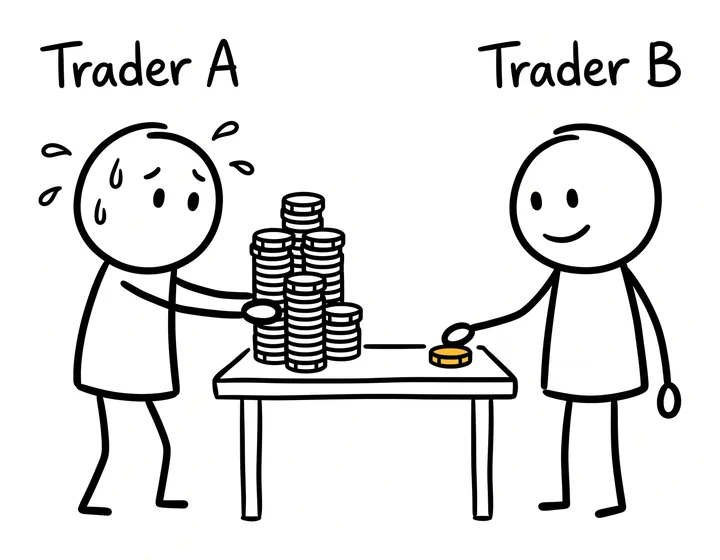
Two traders each get a $100,000 account with a maximum loss of $10,000. The line is static: it sits $10,000 below the starting balance and does not move, like the max loss on an FTMO 2-Step challenge.
Both use the same strategy. It wins half of its trades, and its winners are 1.5 times the size of its losers. That is a genuinely profitable strategy.
- Trader A risks 2.5% per trade: $2,500 on every loss, $3,750 on every win.
- Trader B risks 0.5% per trade: $500 on every loss, $750 on every win.
| Trader A | Trader B | |
|---|---|---|
| Risk per trade | 2.5% ($2,500) | 0.5% ($500) |
| Win (1.5 × risk) | $3,750 | $750 |
| Losses in a row to hit the max loss | 4 | 20 |
| Chance of hitting it in 100 trades | 25% | 0.1% |
Trader A is out after just 4 losses in a row, and we saw above that a 4-loss streak in 100 trades is close to certain. Losses do not have to come in a row, though. They can also pile up between wins.
So we calculated the exact chance that each trader touches the max-loss line at some point in 100 trades. Trader A loses the account 25% of the time. That is one account in four, with a strategy that makes money. Trader B loses it 0.1% of the time.
How we got these numbers
We counted every possible sequence of wins and losses over 100 trades and added up the ones that touch the line. It is exact math for the setup above, not a simulation. Real trading adds spreads, commissions, slippage and, at most prop firms, a daily loss limit as well, so real results will differ. The gap between the two traders is the point.
Trader A is not a worse trader than Trader B. Trader A might even have the better eye for setups. But a 1 in 4 chance of losing everything is a bad bet on any strategy, and it is a choice that Trader A made before the first trade was opened.
Why big risk feels right
If the math is this clear, why do so many traders still size too big?
Because big size feels right in the moment, in two predictable ways.
- After a win, a bigger position feels earned. You were right, so why not press?
- After a loss, a bigger position feels like the fastest way back. One good trade and the day is fixed. This is the start of revenge trading, and it is how a normal losing day turns into the deep hole from the first chart.
Both feelings push your size up exactly when the math says to keep it steady. That is why professional traders decide their risk before the session starts, write it down, and treat it as a rule rather than a mood. If you want to see whether this pattern shows up in your own history, our free revenge-trade check reads an MT5 report and flags trades that were opened bigger right after a loss.
Three habits to take from this lesson
- Decide the loss before the entry. Before you click buy or sell, you should know exactly how much money you lose if the stop is hit. If you do not know that number, you are not ready to take the trade.
- Size for the streak, not the average. Choose a risk per trade that lets you live through 6 or more losses in a row without reaching the deep part of the recovery chart. Lesson 2 shows how to pick that number.
- Never widen a stop to avoid a loss. Moving the stop further away does not cancel the loss. It makes the loss bigger and breaks the size you planned.
Key takeaways
- After a loss you climb back with a smaller account: losing 50% needs a 100% gain, and losing 75% needs 300%.
- Losing streaks are normal. At a 50% win rate, the chance of at least 5 losses in a row in 100 trades is 81%.
- 5 straight losses at 1% per trade cost 4.9% of the account. At 10% per trade they cost 41%.
- With the same profitable strategy, a trader risking 2.5% per trade loses a $100,000 prop account 25% of the time in 100 trades. At 0.5%, it is 0.1%.
- Big size feels right after wins and after losses. Decide your risk before the session, not during it.
Questions
How much do I need to gain to recover from a 50% loss?
100%. After losing half, your account is half its size, so getting back to the start means doubling what is left. A 20% loss needs 25% and a 30% loss needs 42.9%.
How common are losing streaks in trading?
Much more common than most traders expect. With a strategy that wins 50% of its trades, the chance of at least 5 losses in a row somewhere in 100 trades is 81%, and at least 6 in a row is 55%. For a strategy that wins 40% of its trades, 6 in a row happens 87% of the time.
Is a high win rate enough to protect my account?
No. A high win rate still produces losing streaks, and if each loss is large, one streak can take most of the account. What protects the account is the size of each loss compared to the account.
Why does risking more per trade make blowing an account so much more likely?
Because it shortens the streak you can survive. On a $100,000 account with a $10,000 max loss, risking $2,500 per trade ends the account after 4 straight losses, while risking $500 needs 20. Short streaks are common, long ones are rare.
What is a good risk per trade?
There is no single right number, but it should be small enough that a normal losing streak leaves you in the shallow part of the recovery chart. Lesson 2 of this course walks through how to choose it.
Risk management and position size
- 1. Why risk comes first
- 2. How much to risk per trade soon
- 3. Lot size, step by step
- 4. Where to put your stop-loss soon
- 5. Risk-reward and win rate soon
- 6. Losing streaks: what is normal soon
- 7. Daily loss limits and max drawdown soon
- 8. When two trades are really one soon
- 9. Build your risk plan soon
Educational content, not financial advice. Trading forex and CFDs carries a high risk of losing money. Examples use round numbers to show the method; check your own broker's contract specifications and your firm's rules.