In this lesson
You find a clean buy setup on EURUSD. Then, a minute later, an equally clean one on GBPUSD. You take both at 1% risk each, because each one stands on its own.
Do they? Both trades are long against the US dollar. If the dollar suddenly gets stronger, for example after a US data release, both will usually fall together. What looked like two separate 1% trades behaves a lot like one trade at almost 2%.
This lesson shows how to see that hidden risk, using two years of real prices, and how to keep it under control.
Two baskets on one rope
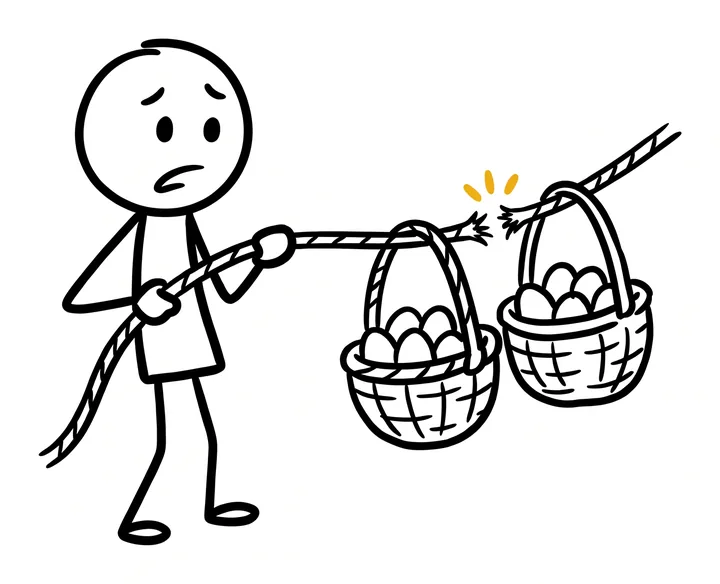
Putting eggs in two baskets only helps if the baskets can fall separately. If both hang from the same rope, two baskets are no safer than one. Correlated trades are two baskets on one rope. The rope is the shared currency, or the shared market mood, that moves them both.
Traders measure how closely two prices move together with correlation, a number from −1 to +1:
- Close to +1: they usually move in the same direction.
- Close to 0: no clear link.
- Close to −1: they usually move in opposite directions.
How closely the majors move together
We measured it. Using daily closing prices from October 2024 to September 2026 (515 trading days), we compared the daily changes of several pairs that traders often hold at the same time.
| Pair | Correlation | Days in the same direction | Swing vs one trade |
|---|---|---|---|
| EURUSD + GBPUSD | 0.80 | 83% | 1.90× |
| AUDUSD + NZDUSD | 0.88 | 84% | 1.94× |
| EURUSD + USDCHF | −0.84 | 16% | 0.56× |
| EURUSD + AUDUSD | 0.62 | 74% | 1.80× |
| EURUSD + USDJPY | −0.62 | 30% | 0.87× |
| EURUSD + XAUUSD | 0.40 | 65% | 1.67× |
Swing = how much a long trade on each pair, same size, moves together compared with one trade. Independent trades: 1.41. Identical trades: 2.
EURUSD and GBPUSD had a correlation of 0.80 and moved in the same direction on 83% of days. AUDUSD and NZDUSD were even closer: 0.88, the same direction on 84% of days.
EURUSD and USDCHF were the mirror image: a correlation of −0.84, moving in opposite directions on 84% of days. That makes sense once you see that the dollar sits on opposite sides of the two quotes.
Even gold, which is not a currency pair, moved with EURUSD more often than not: a correlation of 0.40, the same direction on 65% of days.
About these numbers
Correlation changes over time and can jump during big news, so treat this table as a picture of the last two years, not a law. The idea that matters is stable: pairs that share a currency often move together.
What correlation does to your risk
Here is the practical part. The last column of the table shows how much two trades of the same size swing together, compared with a single trade. Two trades that move completely independently swing 1.41 times as much as one trade, not 2 times, because their ups and downs partly cancel. Two trades that move in perfect step swing 2 times as much: they are simply one double-size trade.
For a long EURUSD plus a long GBPUSD, the number is 1.90. Your two "separate" 1% trades swing almost exactly like a single 2% trade. For AUDUSD and NZDUSD it is 1.94.
The direction matters too. A long EURUSD together with a long USDCHF is the opposite case: those two mostly cancel each other out (a swing of 0.56), so the pair of trades is a much smaller bet than it looks, and also a much smaller chance of profit.
And remember the worst case does not care about correlation at all. If both stops are hit, you lose both amounts. Correlation only decides how often that happens. With pairs that move the same way on most days, it happens a lot more often.
Count your risk per currency

A boat with everyone on one side tips over in a wave that a balanced boat would not even notice. The simplest way to see whether your trades sit on one side is to break each one into its two currencies.
Three trades, one currency
On a $10,000 account you hold three trades, each risking 1% ($100):
- Long EURUSD: long euro, short dollar.
- Long GBPUSD: long pound, short dollar.
- Short USDJPY: short dollar, long yen.
Every one of them is short the US dollar. If the dollar strengthens sharply, all three can lose together. Your real exposure is about $300 on one idea, "the dollar will fall", not three separate 1% trades.
A practical rule:
- Write down each open trade as two currencies, long one and short the other.
- Add up the risk on each currency. Trades on the same side add up; trades on opposite sides partly cancel.
- Cap the total per currency, for example at 2%, and cap the risk of all open trades together, for example at 3%.
Some prop firms make the second cap a written rule. On a FundedNext funded account, all open trades together may risk at most 3% of the initial balance, $3,000 on a $100,000 account (FundedNext help center, as we read it on 7 October 2026).
Before you open a new trade
A quick check takes ten seconds:
- Does this trade share a currency with something already open, on the same side?
- If it does, would I be happy if both stops were hit today?
- Does the total open risk, this trade included, stay under my cap?
If the answer to the last question is no, the right move is not to skip the check. It is to make the new trade smaller, or to skip it. TradeWarden, our MT5 Expert Advisor, adds up every open stop before a new trade and shrinks or refuses the one that would cross the limit you set.
Key takeaways
- Two trades on pairs that move together are partly one bet. EURUSD and GBPUSD moved the same way on 83% of days from October 2024 to September 2026.
- A long EURUSD and a long GBPUSD at 1% each swing about 1.90 times as much as one trade, close to a single 2% position.
- Pairs with the dollar on opposite sides, like EURUSD and USDCHF, mostly cancel out (−0.84 correlation).
- Break each trade into its two currencies and add up the risk per currency. Cap it, and cap the total of all open trades.
- If both stops are hit you lose both amounts. Correlation decides how often that happens.
Questions
Which forex pairs are most correlated?
Pairs that share a currency on the same side. From October 2024 to September 2026, AUDUSD and NZDUSD had a daily correlation of 0.88 and EURUSD and GBPUSD 0.80. EURUSD and USDCHF were strongly negative at −0.84, because the dollar sits on opposite sides.
Is it risky to trade EURUSD and GBPUSD at the same time?
It can double your risk on one idea. Over the last two years they moved in the same direction on 83% of days, so a long trade on each at 1% swings about 1.90 times as much as one trade, close to a single 2% position.
How do I calculate my total risk across open trades?
Add up the money you would lose if every open stop were hit, then check it per currency by splitting each trade into the currency you are long and the one you are short. Three 1% trades that are all short the dollar put about $300 of a $10,000 account on one idea.
What is a good maximum total risk for open trades?
Choose it in advance and keep it small enough that all stops being hit is a bad day, not a disaster. Some firms set it for you: on a FundedNext funded account, all open trades together may risk at most 3% of the initial balance.
Does correlation change over time?
Yes. It moves with the market and can jump around big news, so check it from time to time. The basic rule stays the same: pairs that share a currency on the same side tend to move together.
Risk management and position size
Educational content, not financial advice. Trading forex and CFDs carries a high risk of losing money. Examples use round numbers to show the method; check your own broker's contract specifications and your firm's rules.