In this lesson
Six losses in a row. You check the setups, they look fine. You check the market, nothing special. And still, six losses. At some point the question becomes impossible to ignore: is this just a bad run, or has my strategy stopped working?
Most traders answer that question with their feelings, and their feelings are badly calibrated. Six in a row feels like proof that something is broken. As this lesson shows, for many strategies it is an ordinary month.
Randomness is streakier than it feels
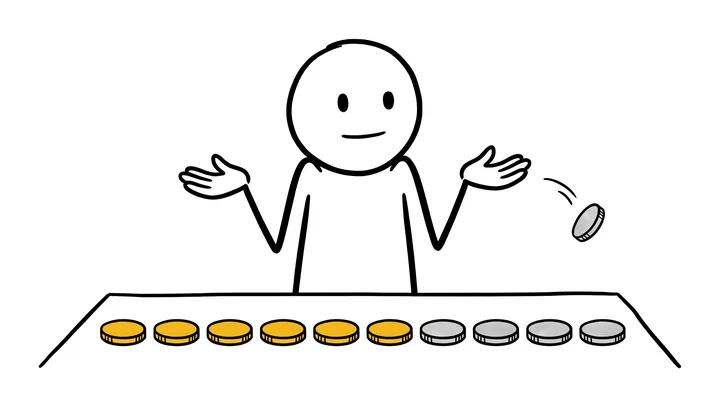
Ask people to write down a "random" list of heads and tails and they rarely write long runs. They switch back and forth, because a run of five heads looks too organised to be random. Real coin flips do not care how it looks. Long runs are a normal part of randomness, and they show up much more often than our instincts expect.
Trading results work the same way. Even when your strategy has a real edge, the order of wins and losses is close to random. So the streaks will come, in about the lengths that the math predicts.
How long a normal streak is
Here is the longest losing streak you should expect, depending on your win rate. "Typical" is the length you have at least a 50% chance of seeing. "Bad but normal" is the length that still shows up 1 time in 10.
| Win rate | Typical in 100 trades | Typical in 250 trades | Bad but normal in 250 |
|---|---|---|---|
| 60% | 4 | 5 | 7 |
| 50% | 6 | 7 | 10 |
| 40% | 7 | 9 | 13 |
| 30% | 10 | 13 | 18 |
Typical = at least a 50% chance of a streak this long. Bad but normal = still a 1 in 10 chance. Exact probabilities.
Read your own row. If your strategy wins 50% of its trades:
- In 100 trades, a streak of 6 losses in a row is typical.
- In 250 trades, 7 in a row is typical, and 10 in a row still happens 1 time in 10.
If your strategy wins 40% of its trades, as many trend-following systems do, a typical 250-trade stretch contains 9 losses in a row, and 13 in a row is bad but normal. At a 30% win rate, the typical longest streak in 250 trades is 13.
So that run of six from the start of this lesson? For a strategy that wins 50% of its trades, it is the typical longest streak in just 100 trades. Nothing is broken.
How we got these numbers
For each win rate, we calculated the exact chance of at least one losing streak of each length within 100 and 250 trades, by following every possible sequence of wins and losses. Real strategies are not perfect coin flips: a strategy's results can cluster in certain market conditions, which makes long streaks a little more common, not less.
What a streak costs at 1% risk
If you followed lesson 2 and risk 1% of your balance per trade, here is what streaks of these lengths cost:
- 5 losses in a row: 4.9% of the account.
- 8 in a row: 7.7%.
- 10 in a row: 9.6%.
- 12 in a row: 11.4%.
That is the reason to size small. A streak of 13 is something a 40% strategy will meet. At 1% it is a painful month. At 5% per trade it would be most of the account.
A short record lies
The other half of the problem is the opposite mistake: judging a strategy from too few trades.
Suppose your strategy truly wins 50% of the time. Over a short stretch, it can easily look much worse:
- In 20 trades, the chance of winning 7 or fewer (35% or less) is 13%.
- In 50 trades, the chance of winning 20 or fewer (40% or less) is 10%.
- In 200 trades, the chance of winning 80 or fewer (40% or less) is 0.3%.
So a 50% strategy shows a 35% win rate over 20 trades more than 1 time in 10. Over 200 trades, a 40% result from a true 50% strategy is very rare. The longer the record, the more it tells you.
This is why traders who switch strategies after every bad week never find out whether any of them worked. They keep judging from 20 trades, which is mostly noise.
Bad luck or broken strategy?

You cannot know for sure in the middle of a streak, but you can ask better questions than "how do I feel?"
- Is the streak longer than your "bad but normal" number? For a 45% strategy over 250 trades, 8 in a row happens 61% of the time and even 10 in a row 24% of the time. A streak inside those numbers is not evidence of anything.
- Did you follow your rules? Go through the losing trades. If they were all valid setups, taken at the planned size, the streak is the strategy's normal cost. If several broke your rules, the problem is execution, not the strategy.
- Has the market changed in a way your strategy depends on? A breakout strategy in a quiet, sideways market, or a range strategy during a strong trend. That is a reason to look closer. A streak on its own is not.
- What does a long record say? Compare your last 100 to 200 trades with your expected win rate, not the last 10.
What to do during a streak
The worst responses to a streak are the ones that feel most natural: trading bigger to win it back, or abandoning the strategy after a week. Here is what works better.
- Keep your risk per trade the same, or lower it. Never raise it to recover. If you measure risk as a percentage of the current balance, your size already shrinks a little with each loss.
- Use a pre-set cut-down rule if you want one. For example: after a 5% drawdown, risk half as much until you are back at the previous high. Decide it now, not during the streak.
- Stop for the day after a few losses. A fixed number of losses per day, such as three, stops one bad session from turning into a deep hole. Lesson 7 builds this into a daily loss limit.
- Keep a journal. Write down every trade during the streak with the setup and whether you followed your rules. It turns a vague feeling into an answer.
Key takeaways
- Losing streaks are a normal part of trading, and longer than they feel. At a 50% win rate, 6 losses in a row is typical in 100 trades.
- The lower your win rate, the longer your streaks. At a 40% win rate, 9 in a row is typical in 250 trades and 13 is bad but normal.
- At 1% risk per trade, 10 losses in a row cost 9.6%. Size so that the streaks you will meet stay survivable.
- A short record lies. A strategy that truly wins 50% shows 35% or less over 20 trades 13% of the time.
- During a streak, keep the size steady or lower, stop for the day after a few losses, and judge the strategy on 100 or more trades.
Questions
How many losing trades in a row is normal?
It depends on your win rate and how many trades you take. For a strategy that wins 50% of its trades, the typical longest streak is 6 in 100 trades and 7 in 250 trades. For a 40% strategy it is 7 and 9.
How do I know if my strategy stopped working?
Compare the streak with the normal range for your win rate, check whether the losing trades followed your rules, and look at a long record of 100 to 200 trades rather than the last 10. For a 45% strategy, 8 losses in a row within 250 trades happens 61% of the time, so 8 in a row alone is not evidence.
Should I stop trading after a losing streak?
Stopping for the day after a fixed number of losses is a good rule, because it keeps one bad session small. Abandoning a strategy because of one streak is usually a mistake, unless the streak is far longer than normal for its win rate or the trades broke your rules.
Should I reduce my risk during a losing streak?
Never increase it. Reducing it is a reasonable rule if you set it in advance, for example halving your risk after a 5% drawdown until you are back at the previous high. If your risk is a percentage of the current balance, it already gets a little smaller after each loss.
How many trades do I need to judge a strategy?
More than most traders think. A strategy that truly wins 50% of its trades shows 35% or less over 20 trades 13% of the time, but 40% or less over 200 trades only 0.3% of the time. Judge on 100 to 200 trades or more.
Risk management and position size
Educational content, not financial advice. Trading forex and CFDs carries a high risk of losing money. Examples use round numbers to show the method; check your own broker's contract specifications and your firm's rules.