In this lesson
In lesson 1 we saw two things. Losses dig a hole that gets deeper faster than it looks, and losing streaks are a normal part of every strategy. This lesson turns those two facts into one practical decision: how much of your account you put at risk on each trade.
Most traders pick this number by feel. Something like "2% sounds reasonable" or "I'll risk more on the good setups." The trouble with a number picked by feel is that it was never tested against the streak that is coming. So in this lesson we will test it, with the same strategy from lesson 1: it wins half of its trades, and its winners are 1.5 times the size of its losers. That strategy makes money. The only question is how big you can trade it without the bad stretches breaking you.
Risk per trade is a percentage, not a lot size
First, a definition. Your risk per trade is the money you lose if the stop is hit, written as a percentage of your account. On a $10,000 account, risking 1% means losing $100 when a trade goes wrong.
It is not a lot size and it is not a number of pips. You choose the percentage first, and then lesson 3's formula turns it into a lot size for wherever your stop happens to be. That order is what keeps every loss the same size, whether your stop is tight or wide.
There is a quiet bonus to measuring risk as a percentage of your current balance. When you lose, the next risk gets smaller on its own. Start at $10,000 and risk 1% per trade: your first loss costs $100. After 10 losses in a row the account is $9,043.82, and the 11th trade risks only $90.44. The brakes come on by themselves, exactly when you need them.
Plan for the streak, not the average
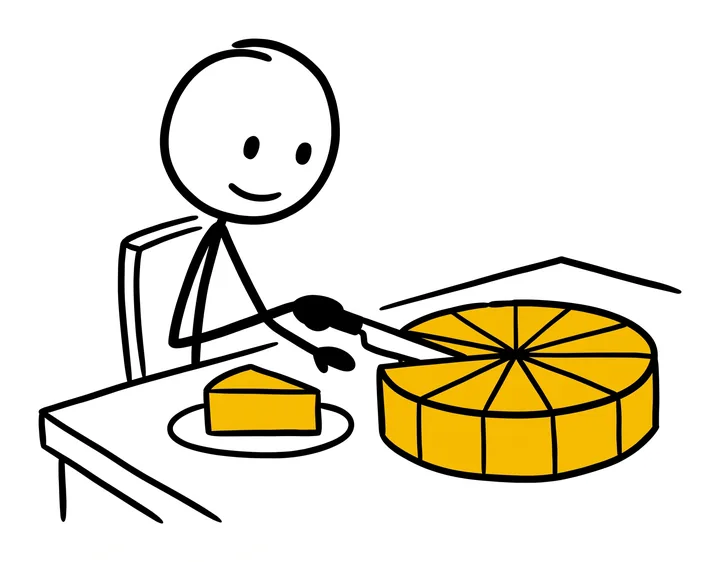
Think of the loss you can live with as a cake. Every losing trade takes a slice. The question is not how many slices you eat on an average day, it is how many slices a bad stretch can take before the cake is gone.
So we need to know how long a bad stretch gets. Say you take about 200 trades a year, roughly four a week. Here is the chance of seeing at least one losing streak of each length somewhere in that year:
| Losses in a row | Strategy wins 50% | Strategy wins 40% |
|---|---|---|
| 6 | 80% | 99% |
| 8 | 32% | 75% |
| 10 | 9% | 38% |
| 12 | 2% | 15% |
Exact probabilities, not a simulation.
For the strategy from lesson 1, which wins half its trades, a run of 8 losses shows up in a year 32% of the time, and a run of 10 losses 9% of the time. For a strategy that wins 40% of its trades, which is normal for trend-following, 10 in a row happens 38% of the time and even 12 in a row 15%.
A simple way to set your planning number: take the longest streak that still has at least a 1 in 10 chance in a year. That is 9 losses in a row for a 50% strategy and 12 for a 40% strategy. Round it to 10 and you have a streak that you can expect to meet, sooner or later.
What each risk level really means
Now we can test the common answers. The table below runs the same strategy through 200 trades at five different risk levels. "Chance of a 20% drawdown" means the chance that, at some point in those 200 trades, the account falls 20% below its highest point so far.
| Risk per trade | 10 losses in a row cost | Chance of a 20% drawdown | Full losses in a 5% day |
|---|---|---|---|
| 0.5% | 4.9% | under 0.1% | 10 |
| 1% | 9.6% | 0.6% | 5 |
| 2% | 18.3% | 30% | 2 |
| 3% | 26.3% | 78% | 1 |
| 5% | 40.1% | 99.8% | 1 |
Each loss is a percentage of the balance at that moment. Drawdown = falling 20% below the highest balance so far.
Read the second column first. 10 losses in a row cost 9.6% of the account at 1% per trade, which hurts but leaves you in the shallow part of the recovery chart from lesson 1. At 3% the same streak costs 26.3%, and at 5% it costs 40.1%.
Then the third column, which is the one that surprises people. With a strategy that makes money, risking 2% per trade gives you a 30% chance of a 20% drawdown in a year. At 3% it is 78%. At 1% it falls to 0.6%, and at 0.5% it is under 0.1%.
How we got these numbers
We followed every possible order of wins and losses over 200 trades, with each trade risking a fixed percentage of the balance at that moment, and added up the paths that fall 20% below their peak. It is exact math, not a simulation. Real trading adds spreads, commissions and slippage, and real strategies do not win exactly half the time, so treat the table as a guide to the size of the danger, not a forecast.
Doubling your risk from 1% to 2% does not double the danger. It multiplies it many times over. That is the single most useful fact in this lesson.
A simple way to choose your number
You can choose your risk per trade in three steps:
- Decide the drawdown you can live with. Not the one you hope for, the one you could sit through without changing your strategy or your sleep. For many traders that is about 10% of the account.
- Decide the streak you plan for. From the first table, 10 losses in a row is a sensible planning number for most strategies that win 40 to 50% of the time.
- Divide. 10% ÷ 10 losses = 1% per trade. Because each loss is a percentage of a slightly smaller balance, 10 losses at 1% actually cost 9.56%, a little less than the budget.
If your strategy wins less often, plan for a longer streak and the answer gets smaller. If you are new to a strategy and do not yet know its real win rate, start at the low end. You can always turn the dial up after a few hundred trades show you what the strategy really does. Turning it down after a 20% drawdown is much harder.
At a prop firm the limits decide for you
A prop firm account turns this from a choice into arithmetic, because the firm has already set your drawdown budget. On a typical $100,000 challenge with a 5% daily loss limit and a 10% maximum loss, here is how many full losses each risk level gives you:
| Risk per trade | Money per loss | Losses to the 5% daily limit | Losses to the 10% max loss |
|---|---|---|---|
| 0.5% | $500 | 10 | 20 |
| 1% | $1,000 | 5 | 10 |
| 2% | $2,000 | 2 | 5 |
Both limits counted from the initial balance, as on FTMO 2-Step.
At 2% per trade, 2 losses end your day and 5 end the account. We saw above how common a 5-loss streak is. At 0.5%, you have room for 10 losses in a day and 20 in total, which turns a normal bad streak into a bad day instead of a failed challenge.
Every firm counts its limits a little differently, for example from the starting balance or from the day's balance. Lesson 7 covers that in detail, and our prop firm rules pages list the exact numbers for each program.
Three mistakes with risk per trade
1. Changing the risk with your mood
Risking 0.5% on a trade you are unsure about and 3% on a trade you love sounds clever. In practice, your confidence is a poor guide to which trades win, and the 3% trades are the ones that dig the deep holes. Pick one number and keep it until your plan says otherwise.
2. Raising it to win back a loss
After a bad day, a bigger position feels like the fastest way back. Lesson 1 showed why this is the start of revenge trading. If anything, the math says the opposite: after a drawdown, a smaller risk protects what is left.
3. Forgetting the trades that are open together
Three open trades at 1% each are 3% at risk if all three stops are hit, and if they are all the same idea, they often are. Lesson 8 shows how to count this.
Key takeaways
- Risk per trade is the money you lose if the stop is hit, as a percentage of the account. Lot size comes after, from the stop.
- Plan for the streak, not the average. In 200 trades, a 50% strategy sees 8 losses in a row 32% of the time, and a 40% strategy sees 10 in a row 38% of the time.
- With the same profitable strategy, the chance of a 20% drawdown in 200 trades is 0.6% at 1% risk, 30% at 2% and 78% at 3%.
- A simple method: the drawdown you can live with, divided by the streak you plan for. 10% ÷ 10 = 1% per trade.
- At a prop firm, divide the daily and total limits by your risk to see how many losses you really have.
Questions
What percentage of my account should I risk per trade?
Choose it from the drawdown you can live with and the losing streak you should expect. Divide one by the other: a 10% drawdown budget and a 10-loss streak give 1% per trade. With a drawdown budget of 5 to 10% and a 10-loss streak, the method lands between 0.5% and 1%, and a new or unproven strategy belongs at the low end.
Is risking 2% per trade too much?
It is more dangerous than it sounds. For a strategy that wins half its trades with winners 1.5 times its losers, 2% per trade gives a 30% chance of a 20% drawdown in 200 trades. At 1% the chance is 0.6%. 10 losses in a row cost 18.3% at 2% and 9.6% at 1%.
What is the 1% rule in trading?
It means never losing more than 1% of your account on a single trade. On a $10,000 account, that is $100 per trade. The value of the rule is that a normal 10-loss streak costs about 9.6%, a drawdown most traders can recover from.
How much should I risk per trade on a prop firm challenge?
Divide the firm's limits by your risk. On a $100,000 account with a 5% daily loss limit and a 10% maximum loss, 1% per trade ($1,000) gives 5 losses per day and 10 in total. At 0.5% ($500) you get 10 and 20.
Should I risk the same amount on every trade?
The same percentage, yes. Changing your risk with your confidence usually means the biggest positions land on the trades you were most emotional about. Keep one percentage and let lesson 3's formula adjust the lot size to each stop.
Risk management and position size
Educational content, not financial advice. Trading forex and CFDs carries a high risk of losing money. Examples use round numbers to show the method; check your own broker's contract specifications and your firm's rules.