In this lesson
Most traders place their stop the wrong way round. They decide how much they can afford to lose, say 20 pips, and put the stop 20 pips away. The stop ends up wherever the money ran out, not where the trade idea fails.
Lesson 3 gave you the tool to fix this. Because the lot size comes from the stop, you never need to squeeze the stop to fit your budget. You put the stop where it belongs, and the lot size shrinks or grows so that the money at risk stays the same. This lesson is about finding where it belongs.
A stop marks where your idea is wrong
Every trade starts with an idea. "Price pulled back to support and will bounce." "The range broke and will keep going." Each idea has a price where it is clearly wrong. If you buy a bounce from a low, and price goes back through that low, the bounce did not happen.
That price is where your stop goes. Not at a round number, not at a fixed distance, but just past the point that proves you wrong.
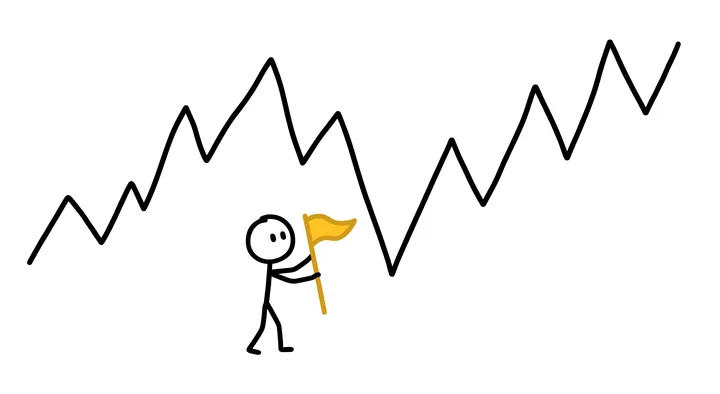
A stop beyond the swing low
You want to buy EURUSD at 1.17000 after a pullback. The pullback's low was 1.16820. If price goes back below that low, the pullback has turned into a fall and your idea is wrong.
So the stop goes a little below the low, with 5 pips of room: 1.16770. That is 23 pips from your entry.
With $100 at risk, lesson 3's formula gives: one lot loses $230 over 23 pips, so $100 ÷ $230 = 0.43 lots. If the stop is hit, you lose $98.90.
The small buffer under the low matters. An obvious low is where many stops sit, and price can poke just through it before turning. A few pips of room is cheap, because the lot size already accounts for it.
Check your stop against normal noise
Even a well-placed stop can be too close. Prices wiggle all day, and a stop inside the normal wiggle will be hit by noise long before your idea has a chance to work.
How big is that wiggle? We measured it. We took EURUSD prices from October 2024 to September 2026 and, at the start of every hour (12,341 starting points), checked how often price touched a level a given distance away within the next 4 and the next 24 trading hours.
| Stop distance | Touched within 4 hours | Touched within 24 hours |
|---|---|---|
| 5 pips | 72% | 90% |
| 10 pips | 49% | 81% |
| 20 pips | 23% | 62% |
| 40 pips | 6% | 35% |
| 80 pips | 0.7% | 10% |
Measured from the start of every trading hour (12,341 starts), buys and sells averaged, 1-minute bid prices.
A stop 5 pips away was touched within 4 hours 72% of the time. At 10 pips, 49%. At 20 pips, 23%. Within a full day, even a 20-pip stop was touched 62% of the time, and a 40-pip stop 35%.
These starting points were picked by the clock, not by a strategy, so the numbers show what plain noise does. Your setups should do better than random, but the lesson is clear: a stop of a few pips on EURUSD is not a safety net. It is a coin that lands on "stopped out" most of the time.
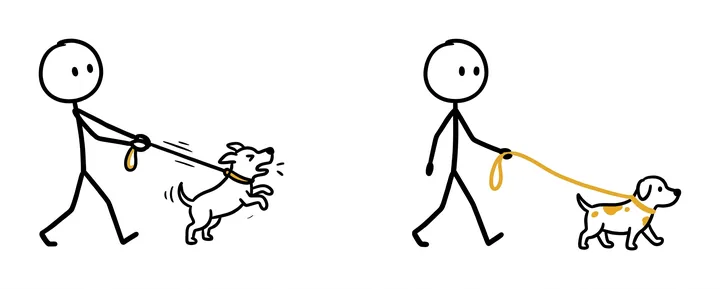
A trade needs a leash long enough for the normal pulling and tugging. Too short and every small move yanks it. That is why the swing-low method and the noise check work together: the structure tells you where the idea fails, and the noise tells you whether that place is far enough away to survive an ordinary hour.
Using ATR as a noise ruler
The Average True Range, or ATR, is an indicator that measures how far price usually travels in one candle. MT5 has it built in. It is a handy ruler for noise on any symbol and any timeframe.
A common method is to keep the stop at least a multiple of the ATR away from the entry, for example 1.5 times:
An ATR stop
On the 1-hour chart, ATR(14) on EURUSD reads 11 pips. 1.5 × 11 = 16.5 pips.
With $100 at risk, one lot loses $165 over 16.5 pips, so you trade 0.60 lots and risk $99.00.
Add ATR in MT5
- Open the chart and choose Insert → Indicators → Oscillators → Average True Range.
- Keep the period at 14 and press OK.
- The value in the indicator window is in price. On a five-digit EURUSD chart, 0.00110 means 11 pips.
ATR does not know where your idea is wrong. Use it as a check on a structure stop, not as a replacement: if the swing low is closer than about one ATR, the setup is probably too tight to trade on that timeframe.
The spread moves your stop
There is a detail that costs sellers money every day without them noticing.
A MetaTrader chart shows the bid price. A buy position closes at the bid, so a buy's stop is hit when the bid reaches it, and what you see on the chart is what you get. A sell position closes at the ask, which is higher than the bid by the spread. So a sell's stop is hit when the ask reaches it, while the chart still shows a lower price.
A sell stop and the spread
You sell EURUSD at 1.17000 with a stop at 1.17200, 20 pips away. The spread is 1.2 pips.
Your stop is hit when the ask touches 1.17200. At that moment the bid, which is the price on your chart, is only 1.17188. On the chart, price moved 18.8 pips against you, not 20, and you are out.
The spread is usually small on EURUSD, but it widens around news and at the daily rollover, and some symbols always have a wide spread. For sells, give the stop that extra room, and if your stops on short trades seem to get hit "before price got there," this is usually why.
Never move a stop further away
Once a trade is open, there is one move that is never part of a plan: moving the stop further away so it is not hit.
It feels like giving the trade more room. What it really does is change the size of your loss after the fact. Take the swing-low trade from above, 0.43 lots with a 23-pip stop. Push the stop out to 46 pips and the loss if it is hit becomes $197.80, double the risk you planned.
If you want a wider stop, decide it before the entry and let the lot size come down. That is the same room for the trade, at the same risk. Moving a stop closer to protect a profit is a different decision, and it is fine as long as it is a rule you set in advance.
Key takeaways
- Put the stop at the price that proves your trade idea wrong, with a little room beyond it. Then let lesson 3's formula set the lot size.
- Check the stop against normal noise. On EURUSD over the last 2 years, a stop 10 pips away was touched within 4 hours 49% of the time, and a 20-pip stop within a day 62% of the time.
- ATR measures how far price usually moves in a candle. A stop closer than about one ATR is likely inside the noise.
- A sell's stop is hit by the ask, not the bid you see on the chart. Give short trades the extra room of the spread.
- Never move a stop further away after entry. It doubles or triples the risk you planned.
Questions
Where should I place my stop-loss?
At the price where your trade idea is proven wrong, plus a little room. For a buy after a pullback, that is just below the pullback's low. For example, with a low at 1.16820 and 5 pips of room, the stop goes at 1.16770.
Why does my stop-loss always get hit before price moves my way?
Usually because it sits inside normal noise. On EURUSD from October 2024 to September 2026, a stop 5 pips away was touched within 4 hours 72% of the time and a 10-pip stop 49% of the time, even at random starting points. Place the stop beyond structure, check it against ATR, and remember that a sell's stop is hit by the ask.
How do I use ATR for a stop-loss?
Read ATR(14) on your trading timeframe and keep the stop at least a multiple of it away, often 1.5 times. If ATR is 11 pips, 1.5 times is 16.5 pips. Then size the trade from that distance so the money at risk stays the same.
Does the spread affect my stop-loss?
Yes, for sell trades. A sell closes at the ask, so its stop is hit when the ask reaches it, while the chart shows the bid. With a 1.2-pip spread, a sell stop at 1.17200 is hit when the chart shows 1.17188.
Is it OK to move my stop-loss?
Moving it further away is not: it makes the loss bigger than you planned, double if you double the distance. Moving it closer to lock in profit is fine if it is a rule you decided before the trade.
Risk management and position size
Educational content, not financial advice. Trading forex and CFDs carries a high risk of losing money. Examples use round numbers to show the method; check your own broker's contract specifications and your firm's rules.