In this lesson
Two claims get repeated in almost every trading community. One says: "Only take trades with at least 1:2 risk-reward, and you can be wrong most of the time and still make money." The other says: "Win rate is everything, find a strategy that wins 80% of the time."
Both are half true, and the missing half is where traders lose money. This lesson puts the two numbers together, shows what a strategy really needs, and then tests the most popular idea of all, that a bigger target makes a trade better, on two years of real EURUSD prices.
Two numbers, one result
Risk-reward compares what a trade can make to what it can lose. A trade with a 20-pip stop and a 40-pip target has a reward of 2 for a risk of 1, written 1:2 or "2R".
Win rate is the share of your trades that reach the target instead of the stop.
Neither one tells you whether a strategy makes money. What does is the average result per trade, often called expectancy:
Expectancy = win rate × average win − loss rate × average loss
We measure wins and losses in R, the amount risked, so that the answer works for any account size.
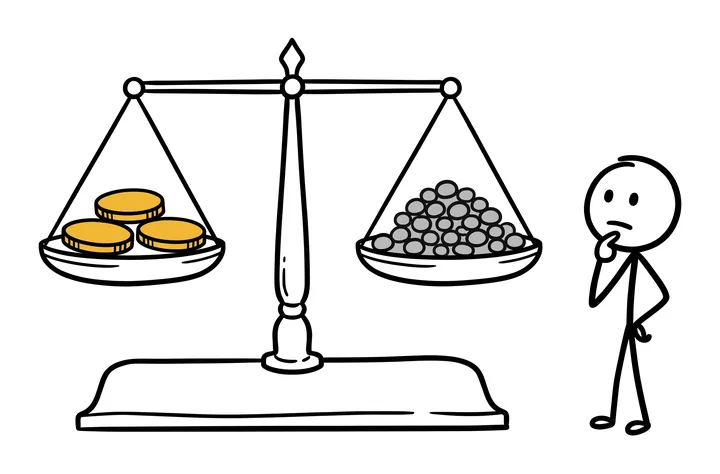
A few big wins can balance many small losses, or many small wins can balance a few big losses. The scale only tips your way when one side is really heavier.
The break-even win rate
For any risk-reward, there is a win rate where the scale is exactly level, and you neither make nor lose money before costs:
Break-even win rate = 1 ÷ (1 + reward-to-risk)
| Risk-reward | Target vs stop | Break-even win rate |
|---|---|---|
| 1:0.5 | 0.5 × the stop | 66.7% |
| 1:1 | 1 × the stop | 50% |
| 1:1.5 | 1.5 × the stop | 40% |
| 1:2 | 2 × the stop | 33.3% |
| 1:3 | 3 × the stop | 25% |
Before spreads and commissions. Break-even win rate = 1 ÷ (1 + reward-to-risk).
At 1:1 you need to win 50% of the time. At 1:2 you only need 33.3%. At 1:3, 25%. And at 1:0.5, where the target is half the size of the stop, you need 66.7%.
So the first claim is true as far as it goes: with a 1:2 target you can be wrong most of the time. But it hides a question. Does a bigger target let you keep the same win rate?
A bigger target is harder to reach
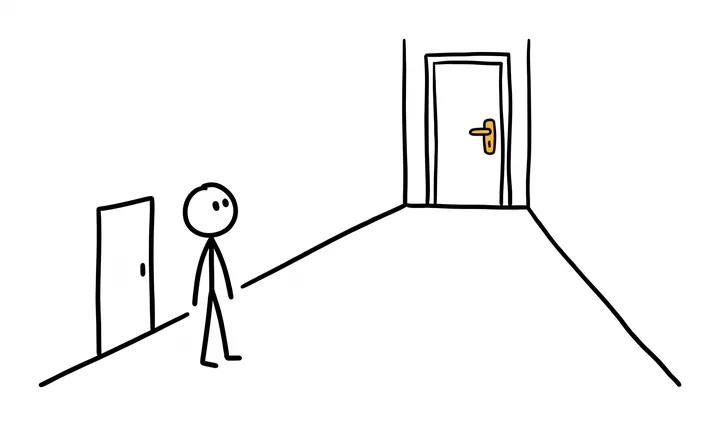
A target twice as far away is, of course, harder to reach. The question is how much harder. If prices moved with no pattern at all, the math says the win rate would fall exactly to the break-even line, and risk-reward would make no difference.
We tested this on real prices. From October 2024 to September 2026, we opened a pretend EURUSD trade at the start of every hour, half of them buys at the ask and half sells at the bid, so the spread is included. Every trade had a 20-pip stop. We ran the whole test three times, with the target at 20, 40 and 60 pips, and recorded which one price touched first. That is 24,490 trades per test.
| Target | Trades that won | Needed to break even | Average result |
|---|---|---|---|
| 20 pips | 48.7% | 50% | −0.026R |
| 40 pips | 33.2% | 33.3% | −0.005R |
| 60 pips | 25% | 25% | 0.000R |
One buy and one sell opened at the start of every trading hour, about 24,490 trades per row, spread included.
With a 20-pip target, 48.7% of the trades won, just under the 50% needed to break even. Doubling the target to 40 pips cut the win rate to 33.2%, right on the 33.3% break-even line. At 60 pips, 25% won, where 25% was needed.
In each case, the bigger target was paid for, almost exactly, with a lower win rate. The average result stayed around zero: −0.026R, −0.005R and 0.000R per trade. The small losses at the shorter targets are the spread.
What this test does and does not show
These trades were opened by the clock, not by a strategy, so they show what plain price movement does. They do not show that no strategy can do better. They show that changing the target, on its own, does not create an edge. Your edge has to come from where and when you enter, and then the risk-reward decides how that edge is paid out.
So the honest version of the first claim is: a 1:2 target lets you be wrong most of the time, but only if your entries are good enough to win more than 33.3% of the time at that distance.
High win rate, low profit
Now the second claim, that win rate is everything. Look at two traders over 100 trades, each risking $100 per trade:
- Trader A wins 70% of the time, but takes profit at half the stop distance (a reward of 0.5R). Expectancy: 0.70 × 0.5 − 0.30 × 1 = 0.05R per trade, or $500 after 100 trades.
- Trader B wins only 35% of the time, with a reward of 2.5R. Expectancy: 0.35 × 2.5 − 0.65 × 1 = 0.225R per trade, or $2,250 after 100 trades.
Trader A is right twice as often and earns less than a quarter as much. And Trader A's edge is thin: break-even at 1:0.5 is 66.7%, so if the win rate slips from 70% to the break-even line, the profit is gone.
Trader B has a different problem: losing streaks. At a 35% win rate, long runs of losses are part of the deal. A strategy that wins 30% of the time has a 58% chance of 10 losses in a row somewhere in 100 trades. Lesson 6 looks at what that feels like and how to tell it apart from a broken strategy.
Costs hit tight stops hardest
Spreads and commissions are paid on every trade, win or lose, and they are paid in pips. So the tighter your stop, the bigger they are compared to your risk.
Say your costs on EURUSD are a 1.0-pip spread plus a $7 commission per lot for the round trip, which works out to another 0.7 pip. That is 1.7 pips per trade. Here is what it does at a 1:2 risk-reward:
| Stop | Costs per trade | Break-even win rate at 1:2 |
|---|---|---|
| 5 pips | 0.34R | 44.7% |
| 10 pips | 0.17R | 39% |
| 20 pips | 0.08R | 36.2% |
| 50 pips | 0.03R | 34.5% |
Without costs, a 1:2 trade breaks even at 33.3%.
With a 50-pip stop the costs are 0.03R per trade and the break-even win rate barely moves, from 33.3% to 34.5%. With a 5-pip stop the costs are 0.34R per trade, and you now need to win 44.7% of the time just to break even. Combine that with lesson 4, where a 5-pip stop was touched within 4 hours 72% of the time, and you can see why very tight stops are so hard to make work.
How to use this
- Know your two numbers. Write down your real win rate and your real average win and loss in R from your last 50 to 100 trades. Not the ones you remember, the ones in your history.
- Work out your expectancy. If it is not clearly above zero after costs, a different target will not fix it. The entry is the problem.
- Choose a target your entries can reach. A target that looks good on paper but that price rarely reaches only lowers your win rate.
- Respect the streaks your choice brings. A low win rate is fine if you size for the long streaks it will produce (lesson 2).
Key takeaways
- Expectancy, not win rate or risk-reward alone, decides whether a strategy makes money: win rate × average win − loss rate × average loss.
- Break-even win rate = 1 ÷ (1 + reward-to-risk): 50% at 1:1, 33.3% at 1:2, 25% at 1:3.
- On real EURUSD prices with random entries, a bigger target lowered the win rate almost exactly to the break-even line: 48.7%, 33.2% and 25% for 20, 40 and 60-pip targets with a 20-pip stop.
- A high win rate with small wins can earn less than a low win rate with big wins: 0.05R per trade against 0.225R in our example.
- Costs are paid in pips, so they hurt tight stops most. With 1.7 pips of costs and a 5-pip stop, a 1:2 trade must win 44.7% of the time to break even.
Questions
What win rate do I need with a 1:2 risk-reward ratio?
33.3% to break even before costs, because 1 ÷ (1 + 2) = one third. Costs push it higher, and more so with tight stops: with 1.7 pips of costs, a 1:2 trade with a 20-pip stop needs 36.2%, and with a 5-pip stop 44.7%.
Is a higher risk-reward ratio always better?
No. A farther target is reached less often. In our test on EURUSD from October 2024 to September 2026, random entries with a 20-pip stop won 48.7% with a 20-pip target, 33.2% with a 40-pip target and 25% with a 60-pip target, almost exactly the break-even rate each time. The edge has to come from the entry.
What is a good win rate in trading?
There is no good win rate on its own. A strategy that wins 35% of the time with 2.5R winners makes 0.225R per trade, while one that wins 70% with 0.5R winners makes only 0.05R. Judge the win rate together with the average win and loss.
How do I calculate expectancy in trading?
Multiply your win rate by your average win, then subtract your loss rate times your average loss, all in R. For example, 0.35 × 2.5 − 0.65 × 1 = 0.225R per trade, so 100 trades risking $100 each would make about $2,250 before costs.
Why do tight stops lose money even with a good risk-reward?
Because costs are paid in pips. With 1.7 pips of spread and commission, a 5-pip stop loses 0.34R to costs on every trade, and the break-even win rate at 1:2 rises from 33.3% to 44.7%. Tight stops are also touched by normal noise far more often.
Risk management and position size
Educational content, not financial advice. Trading forex and CFDs carries a high risk of losing money. Examples use round numbers to show the method; check your own broker's contract specifications and your firm's rules.